4 min read

Why consistent interpretation — not necessarily more data — determines program maturity.
External corrosion surveys generate large volumes of technically rich data. The challenge is not collection, it’s consistent interpretation.
Two engineers analyze the same close interval survey. They analyze the same data according to the same regulatory framework. They produce different action items or follow-up measures. This isn't a personnel/training problem. It's a systems problem, and at enterprise scale, it becomes a defensibility problem.
Most pipeline operators meet their regulatory survey requirements consistently. CIS, DCVG, ACVG, and inline inspection programs are technically mature. Data acquisition is rarely where programs fail. The vulnerability lies in what happens after the data is collected: interpretation that depends on localized spreadsheet logic, regional threshold adjustments, and informal workflows that evolve differently across divisions over time.
That drift, compounded over years, is what exposes programs during audits.
External Corrosion Management is a Data Integration Problem Before It's an AI Problem
Before any responsible conversation about machine learning in pipeline integrity, there's a simpler engineering reality that must be confronted: external corrosion data is fragmented.
CP and CIS readings live in one system. Inline inspection metal loss data lives in another. Repair logs exist somewhere in GIS or a maintenance database. Soil properties and coating attributes may not be reliably stored anywhere.
Engineers manually correlate these sources during review. They align odometer discrepancies by hand. They reconcile weld mismatches between ILI runs. They compare CP performance against historical anomaly growth visually.
That manual integration step is where variability begins, and it's also where AI fails if it's deployed too early. Machine learning models require structured inputs, consistent labeling, and spatial and temporal alignment across datasets. If two divisions align their CIS to ILI data using different methods, any model built on top of that will inherit the inconsistency. The model doesn't know the data is misaligned. It just learns the wrong patterns.
AI amplifies structure. It does not compensate for its absence.
(Want to read how we harness AI to integrate and unify data in preparation for analysis? Read More Here.)
Why Variability Compounds at Enterprise Scale
In smaller programs, interpretation variability is often manageable because teams share context. Engineers know each other's judgment calls. Historical decisions can be explained over coffee.
As organizations grow, that shared context dissolves.
One division may apply -0.85V CP criteria strictly. Another incorporates situational judgment around stray current behavior. Some engineers weigh soil corrosivity databases heavily. Others may prioritize recent ILI growth trends. None of these approaches is inherently wrong — but when they coexist across a large enterprise without structured standardization, decisions diverge quietly over time.
Prioritization logic drifts. Documentation varies. Reproducing a dig rationale from three years ago becomes an exercise in institutional memory rather than documented analysis.
During an audit, that's when the exposure becomes visible. Can the organization demonstrate that similar external corrosion indications were prioritized consistently across divisions? Can it explain, with documented logic, why one location was mitigated while another was deferred? If those answers depend on who was reviewing that segment at the time, defensibility is fragile.
This is not a critique of the engineers involved. It is a systems problem — and it requires engineered automation to solve.
What Structured Interpretation Actually Looks Like
Reducing variability means automating the analysis process itself, not just the data collection.
In practice, that starts with spatial alignment: connecting CIS data to ILI data using GPS-based mapping and weld matching rather than manual approximation. From there, anomaly matching across ILI runs can be handled with pattern recognition algorithms so that growth behavior is calculated the same way every time, regardless of who is running the analysis.
Automated EC Survey Analysis transforms raw Close Interal Survey datapoints, often containing hundreds of thousands of measurements, into structured, repeatable indicators of cathodic protection performance and coating condition. The automation performs data quality validation, extracts infrastructure features using pattern recognition, enforces NACE-based compliance criteria (e.g., Off reading doesn't meet - 0.85 V), and applies signal processing techniques such as Butterworth filtering and peak/valley detection to identify CP deficiencies, coating degradation, and potential stray current sources and sinks. By embedding these checks and correlations into an algorithmic process, interpretation becomes consistent, reproducible, and scalable across surveys and years of operation.
Rather than applying discrete voltage thresholds to CIS data, this advanced analysis can identify regions of inadequate CP, stray current pickup and drop-off, and coating degradation indicators that a manual threshold-based review would miss.
Statistical growth modeling, aka data science models, takes this further. By calculating normalized metrics across ILI populations — not just flagging individual anomalies — engineers can identify whether a corrosion zone is accelerating, stable, or trending toward a threshold exceedance. Skewness, for instance, is a useful signal here: a population with high positive skew suggests a small number of features growing significantly faster than the rest, which warrants a different response than a normally distributed population of slow-growing anomalies.
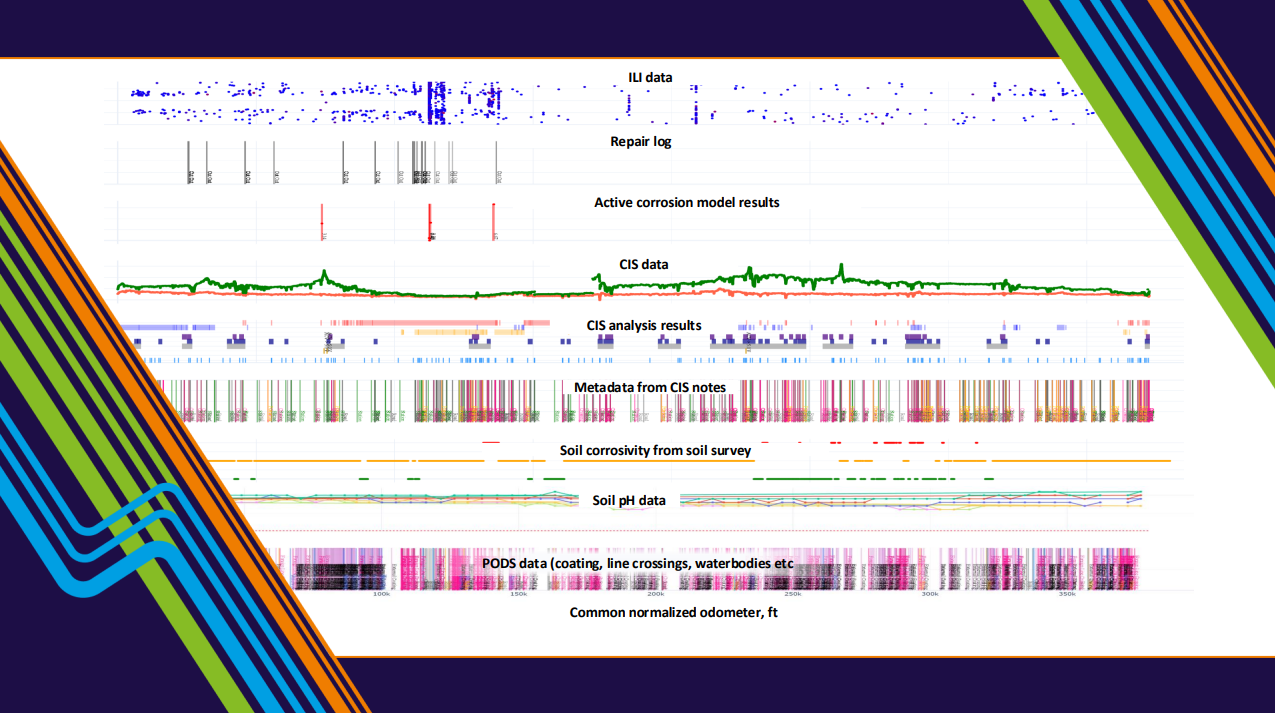
Integrating soil corrosivity, pH, coating type, GIS crossings, and repair history into a common normalized odometer reference completes the picture. All of these data points are unified and visually displayed in an interactive visualization tool for further analysis, either manually (visually) or automatically.
This framework was validated across three operators, analyzing 300 inline inspections covering 4,152 km of pipeline, and was presented at the Rio Pipeline 2025 Conference. The key finding wasn't simply that active corrosion could be identified — it was that it could be identified consistently across large, heterogeneous datasets. That consistency is the foundation of defensibility.


The Bridge to Enterprise AI
The previous posts in this series traced the progression from unified data to scalable automation to probabilistic corrosion forecasting. Before going further into AI deployment, it's worth being direct about what breaks down without this foundation in place.
Standardizing external corrosion interpretation is not the end state. It is the prerequisite.
Once spatial alignment, anomaly matching, CIS feature extraction, and statistical growth modeling are embedded into repeatable workflows, something genuinely useful becomes possible: explainable AI operating on a foundation that can defend every output it generates.
That means AI that can interrogate your aligned integrity datasets and answer natural-language questions about corrosion growth behavior, CP performance, and cross-threat correlation — within your own data environment, against your own history.
It means AI-assisted reporting that transforms validated datasets into defensible executive summaries rather than requiring engineers to translate technical findings manually. It means regulatory guidance tools that map PHMSA 49 CFR 192 and 195 citations directly to integrity workflows rather than requiring engineers to do that translation from scratch every time.
None of that works if the underlying interpretation is inconsistent. All of it becomes a genuine force multiplier when it isn't.
Enterprise corrosion management maturity isn't measured by survey volume or tool sophistication. It's measured by whether interpretation logic is engineered and reproducible — and whether the AI built on top of it can be trusted to defend every decision it informs.