3 min read
On a 10-inch line that's been in the ground since 1971, a standard pit-to-pit corrosion growth model predicted a metal loss anomaly would be at 50% wall loss by 2024. The dig came back, revealing a 35% depth. A 15-point miss on a single feature is enough to send a crew out to dig somewhere it didn't need to. If the error runs in the other direction, it will leave real growth sitting unmitigated.
That gap is exactly what Brandon Charrier (Irth Solutions) and Andres Marquez Socorro, a pipeline integrity engineer and AIP user, set out to explain at last year’s Irth User Summit, in a session called "Beyond Pit-to-Pit."
The question on the table?
Is AIP’s Historical Growth Trend model, which uses every ILI run on record instead of just the two most recent, more accurate than the pit-to-pit approach most operators default to?
The Problem With Two Data Points
Most corrosion growth rate (CGR) calculations, whether from an ILI vendor's callbox matching or AIP's own pit-to-pit CGR model, work the same way: take the two most recent inline inspections, match a metal loss anomaly between them, and divide the depth change by the years elapsed. It's a simple calculation — and a fragile one.
A growth rate built on just two measurements inherits all the noise of both values. Error from tool tolerance, a short re-inspection interval, and high wall thickness can compress the signal relative to the error. Get unlucky with that noise, and you land in one of two places: an overly conservative rate that identifies digs you didn’t need and throws off long-range planning, or a non-conservative rate that quietly buries a feature that has a high corrosion rate under a blanket of "tool tolerance."
What if, instead of trusting two points, you trusted the trend line running through all of them?
A Different Approach: Historical Growth Trend
That's the premise behind AIP's Historical Growth Trend model. Rather than pit-to-pit matching between the last two ILIs, it runs a linear regression through a single matched pit across every available ILI year for that feature — five inspections instead of two, in some cases. The result is a growth rate that's structurally less sensitive to any one inspection's tolerance or an unusually short re-inspection window, because a single data point no longer has a high impact.
It's not a new idea in principle. It is, however, a CGR method that's barely used in practice. Across all analyses in AIP today, Historical Growth Trend accounts for just 2.7% of the total, dwarfed by pit-to-pit minimum and half-life defaults. This study was the first real attempt to find out whether that low adoption is justified, or whether the model's just been underutilized.
Putting It to the Test
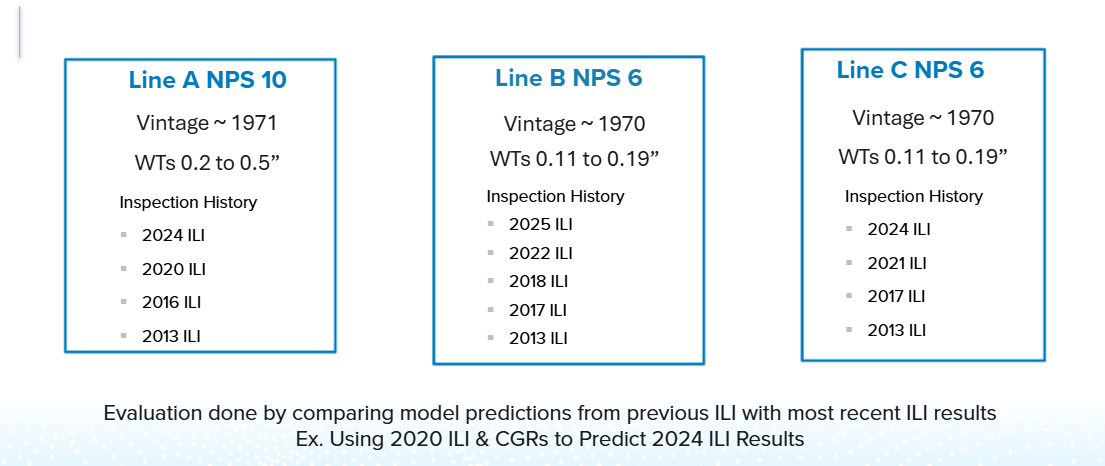
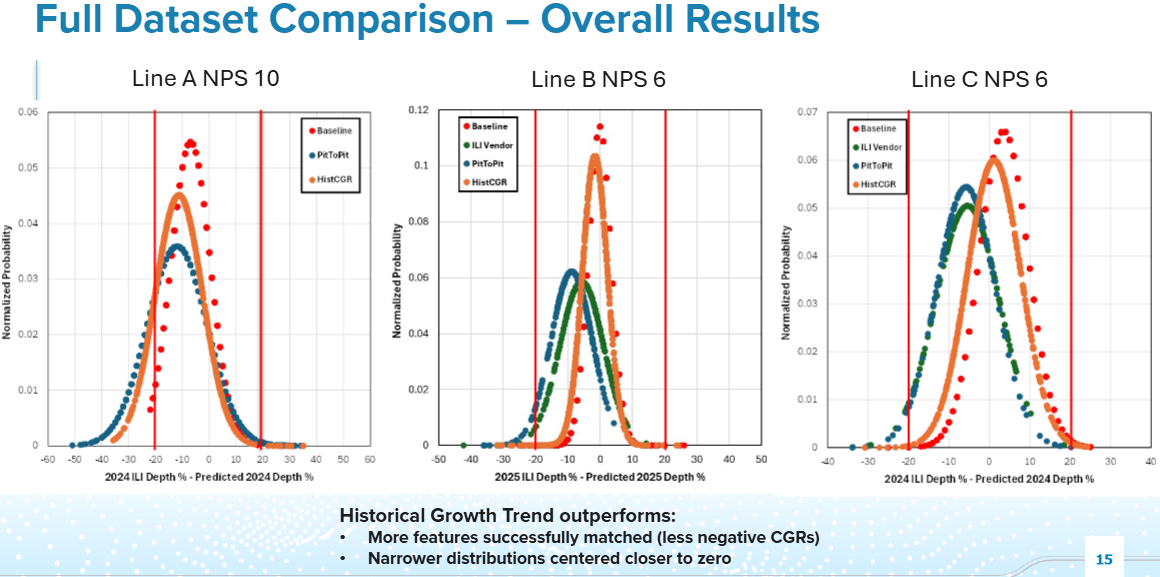
Andres ran the validation on three pipeline segments — two 6-inch lines and one 10-inch, all vintage 1970–71, with wall thicknesses ranging from 0.11" to 0.5", and ILI histories stretching back to 2013. The test design was straightforward: take the ILI history of predicted depths, generate a predicted depth for anomalies in the newest ILI using each model, and analyze the distributions.
The results were consistent across all three lines: Historical Growth Trend produced narrower, better-centered prediction distributions than either pit-to-it minimum or ILI vendor callbox matching. More features matched successfully (fewer defaulted to a conservative floor rate for lack of a clean pit-to-pit pair), predictions clustered closer to zero error, and — the part that matters for your dig budget — the model showed a meaningfully lower tendency to over-predict depth. On the under-prediction side, where a model errs by calling a feature shallower than it really is, Historical Growth Trend performed at least as well as pit-to-pit, and in some cases more conservatively.
One individual feature (ID 11493) made the case bluntly: pit-to-pit predicted 50% depth for 2024; the 2024 inline inspection came back at 30%, confirmed by an NDE inspection that revealed a 35% depth. Historical Growth Trend predicted 34%.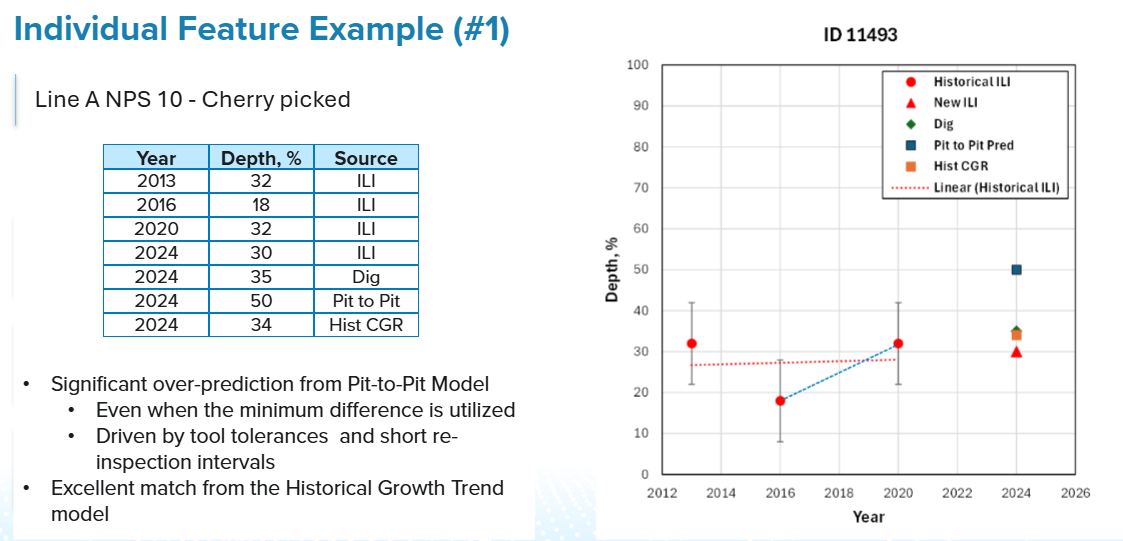
The Caveats
None of this means outliers can be forgotten. Severe, localized growth drivers — MIC, elemental sulfur, CP interference — aren’t reliably caught by either model, and truly monitoring them still requires short reinspection intervals regardless of which growth rate you’re trusting elsewhere in the population. Additionally, this approach relies on ILI data quality: poor ILI performance across five inspection years produces a poor trend line just as easily as pit-to-pit does.
What's Next?
For AIP users sitting on multi-year ILI histories, running this same comparison on your own pipelines is straightforward. Take an older ILI, generate predictions under both your current pit-to-pit approach and Historical Growth Trend, and see how each holds up against your most recent inspection. The pattern held across three very different lines in this case study. The only way to know if it holds for you is to run the numbers.
Interested in coming to our User Summit?