How Excavation Ticket Prioritization Works: Using Risk Scoring to Focus on What Matters
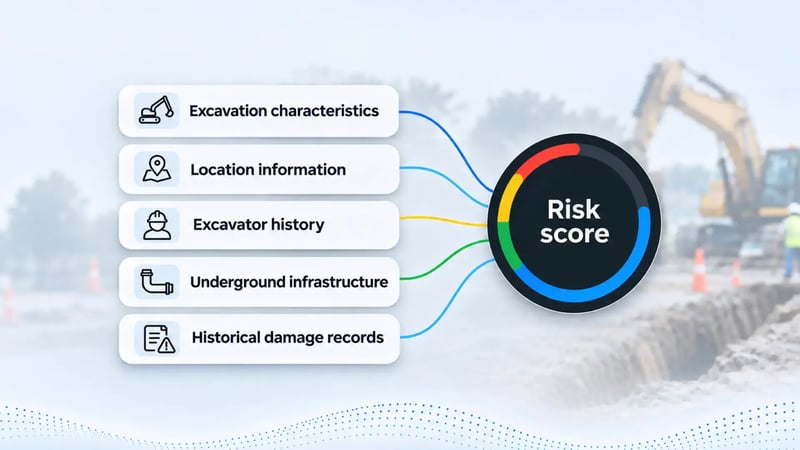
Learn how excavation ticket management uses analytics and risk scoring to identify higher-risk 811 tickets and focus damage prevention efforts.
6 min read
In Part One, I made the case that pipeline integrity is heading where commercial aviation went in the 1970s. Aviation got safe enough that it ran out of failures to learn from, so it built a voluntary, confidential, non-punitive system for reporting near misses instead, and later extended the same logic to pooled operational data with ASIAS. Two things had to happen for that to work: operators had to share what they learned, and they had to share the underlying data.
Part one was about shared learnings, i.e., the methodologies we take from C-FER, from PRCI, from our own operators, and build into one version of the software so everybody gets them.
This one is about the harder half. What does pooled data get you? Better models and industry benchmarking. The models that matter most are the ones no single operator has enough data to build alone. And the only way to know whether your ILI program is performing well is to compare it against everyone else’s, which no operator can do from inside its own dig results.
Internal corrosion has been the documented cause behind roughly 12% of hazardous liquid and gas transmission incidents over the past decade, per PHMSA. The form that produces the worst surprises, bottom-side pitting, tends to create defects right at the edge of what an ILI tool can confidently detect and size. Which means the threat you most need to catch is the one your inspection tool is least equipped to show you.
We built the Internal Corrosion Susceptibility Model to find those regions before they fail. It doesn’t try to model the chemistry. It combines five individually weak signals into one strong one: pinhole fraction within a rolling window, statistical depth outliers, an active corrosion score derived from comparing matched anomalies across two ILI runs, proximity to elevation valleys where water and sediment settle, and orientation weighting centered on 6 o’clock. Multiply them together, and a region only scores high when several weak signals line up at once, which is a much rarer and much more meaningful event than any single factor crossing a threshold.
Now, the part that’s relevant here. That model exists because of two datasets, and neither one belonged to us.
The first is PHMSA’s public release database. We mined it for confirmed internal corrosion failures to use as ground truth, then ran a grid search across window sizes, outlier sensitivity, and factor weights to find the configuration that ranked true failure regions highest. The best configuration hit an average ranking performance of 0.82, with a perfect score on two pipelines. Then we tested it blind against a line with two confirmed releases it had never seen. First pass caught one of the two. After folding that pipeline in and retuning, it caught both.
The second is the inline inspection data our clients have in the platform. Without a large body of aligned, normalized ILI data sitting in one place, there is nothing to tune the model against and no way to know whether the five factors cluster near real failures or just look plausible.
Take away either dataset, and there’s no model. The public failure record alone doesn’t tell you what the pipe looked like beforehand. The ILI data alone doesn’t tell you which regions went on to fail.
Our team pushed this further for stress corrosion cracking. Using ILI and soil data from six pipeline operators across more than 30,000 km of pipe, they built a weighted susceptibility classifier and benchmarked it against a fully trained XGBoost model, including a hard look at how the wrong validation split can quietly inflate your results. That work is being presented at IPC 2026 in Calgary as “SCC Susceptibility Modeling to Demonstrate New Guidelines for Machine Learning in Pipeline Integrity.”
No single operator among the six had enough data to build that classifier alone, and every one of them now has a better model than it could have built by itself. It’s the same principle aviation applied with ASIAS, i.e., pool de-identified data across carriers to find patterns no single carrier could see.
Pooled data also lets us publish industry benchmarks no operator could produce alone. The State of Integrity report we presented at PPIM 2025 drew on 11,676 inline inspections across 412,719 miles from 17 operators and 34 different ILI companies to ask a question no operator can answer from their own dig program: what drives ILI system performance? Comparing ILI-predicted depth against field-found depth across 81,497 anomalies, three findings give you the flavor. Depth sizing certainty for the same nominal MFL technology ranges from 49% to 85% depending on which company ran the tool. Anomaly depth had the highest effect on sizing accuracy, while metal loss classification had the lowest, which is close to backward from how ILI performance specifications are typically written. And industry-wide performance has been declining since 2020 after sixteen years of steady gains, a four-year reversal that’s invisible from inside any single program, where it reads as noise or one vendor having an off stretch. Like ASRS, the Aviation Safety Reporting System, the State of Integrity report anonymized the ILI companies. People share more freely when what they contribute can’t be traced back to them.
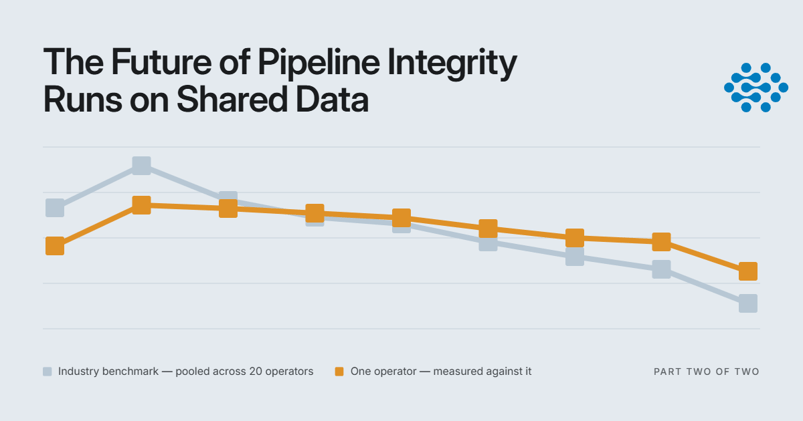
We’ve since taken the same analysis down to the individual operator. The 2026 State of ILI Performance report benchmarks each operator’s depth sizing against the pooled results of 20 operators in AIP. Industry-wide, 72.7% of ILI depth calls land within ±10% wall thickness of the depth measured in the field, and top-quartile operators reach 82.4%. So what separates them? Mostly not the vendor. Across the cleaned dataset, the pipeline operator is the second-largest driver of depth sizing accuracy after anomaly depth itself, ahead of both the ILI company and the tool technology. That points to things an operator controls, e.g., tool run speed and flow, line cleaning, which tool runs on which segment, and how field depths get measured and recorded in the dig.
Two findings stand out. Top-quartile operators average 26 field-verified anomalies per inspection against 15 for everyone else, which points to more digs being fed back to calibrate the ILI. And on anomalies 40% or deeper, i.e., the ones that matter most, UT ML lands within ±10% of the field depth 66.1% of the time against 49.3% for standard MFL-A. None of that is visible from inside one program. An operator looking at its own dig results can see where its vendors missed; it can’t see that a peer running similar pipe is getting materially better results, or why. That comparison only exists because the data is pooled.
Here’s what those comparisons look like for two operators in the pool, anonymized. Operator A sizes the deep anomalies that drive repair decisions well ahead of the industry: on anomalies 80% of wall or deeper, 31.7% of its depth calls land within ±10%, against 14.1% industry-wide. Operator B tells the more interesting story, by vendor. Five of the six ILI companies it uses size depth more accurately on its pipeline than they do across the industry, one of them by more than 20 points. Those are the same vendors running on everyone else’s pipe, which points to the operator’s side of the equation, i.e., exactly what the pooled analysis says should matter. Each comparison tells an operator what’s working and worth protecting, which is as useful as knowing what to fix.
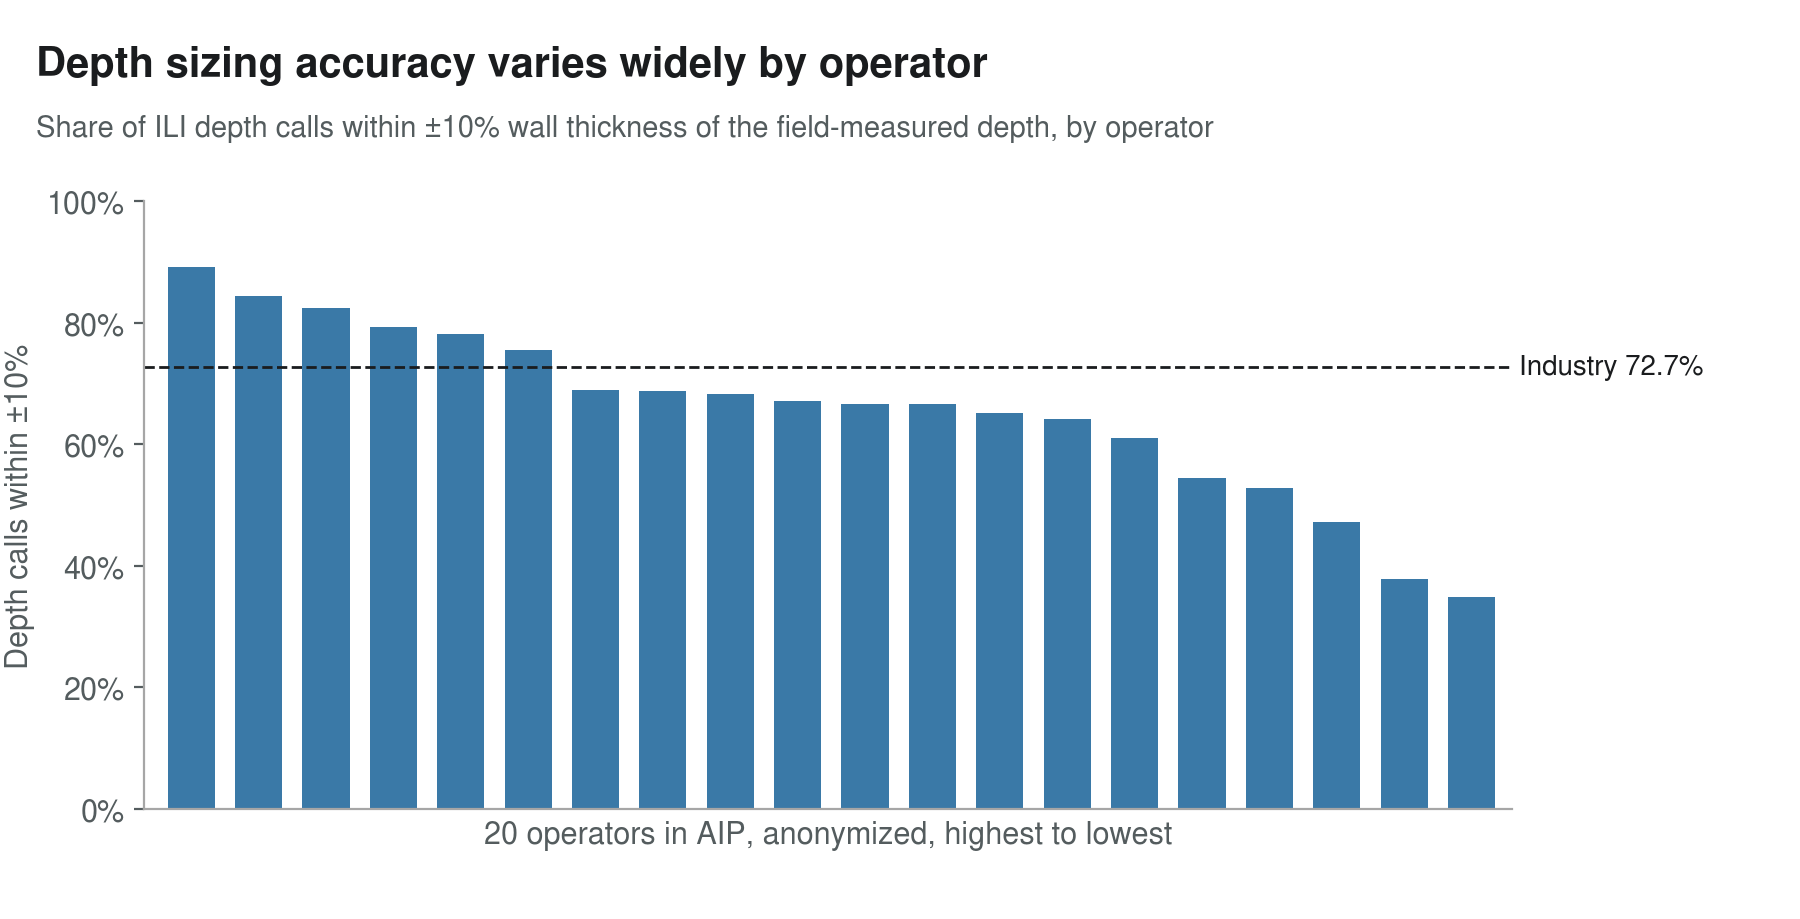
Source: Irth, 2026 State of ILI Performance. Industry benchmarks pooled across 20 operators in AIP. Each bar is one operator; none are identified.
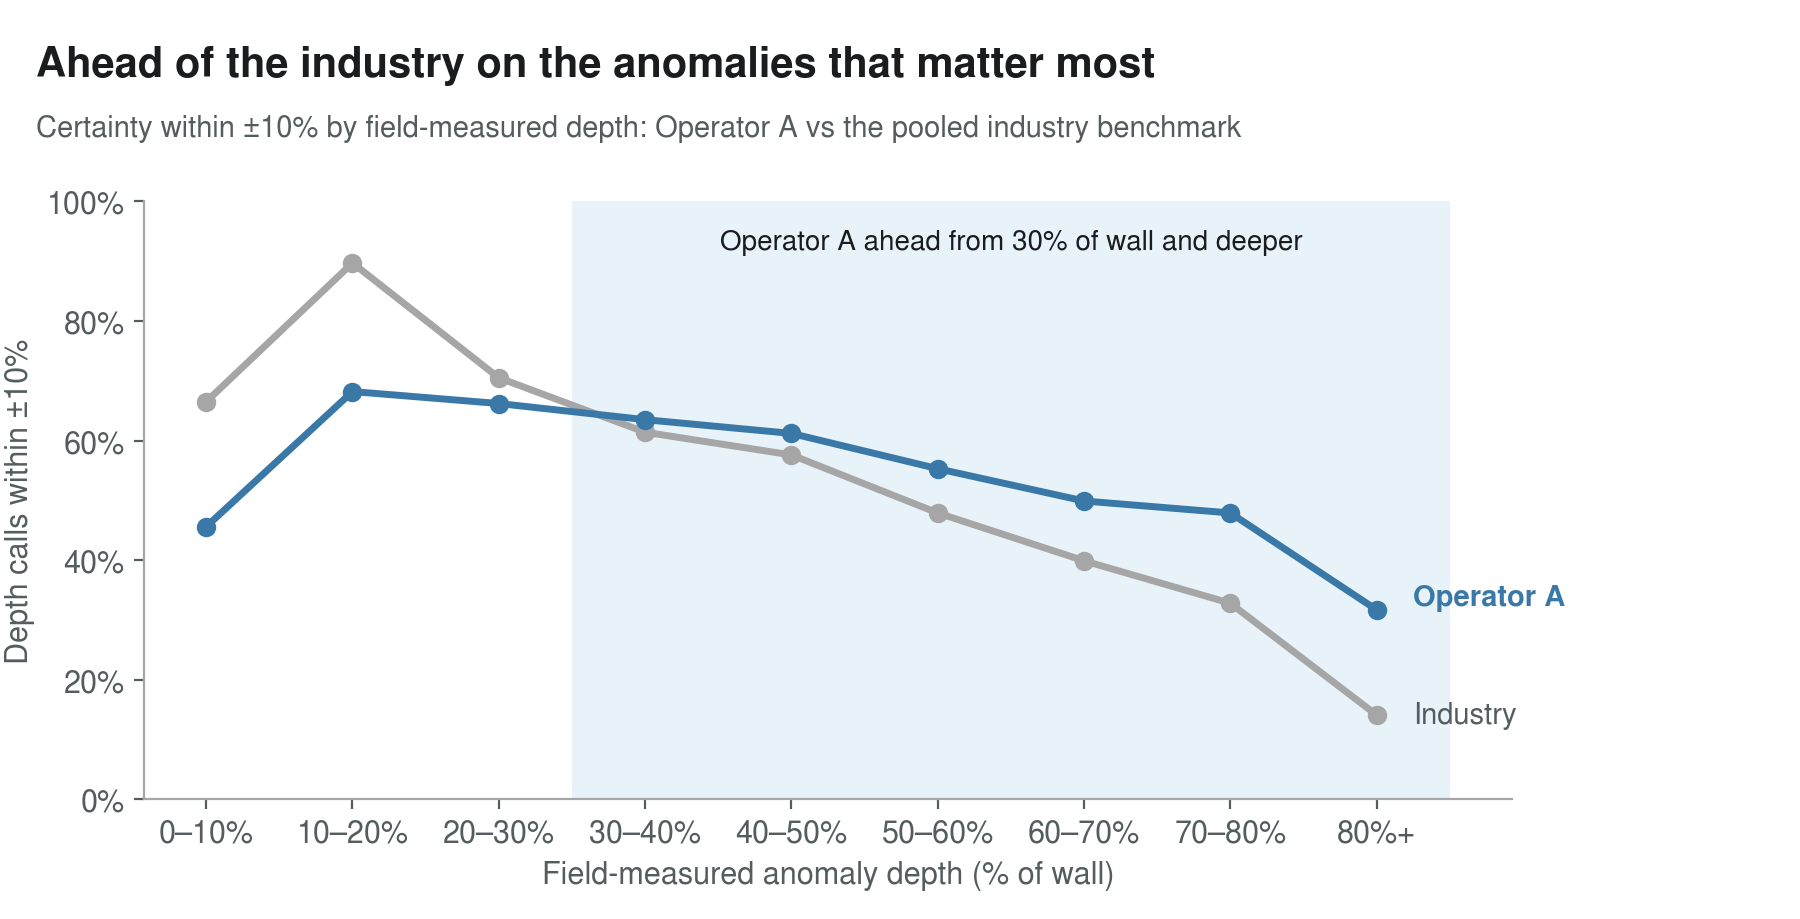
Source: Irth, 2026 State of ILI Performance. Industry benchmarks pooled across 20 operators in AIP. Operator A is anonymized; Operators A and B are two different operators.
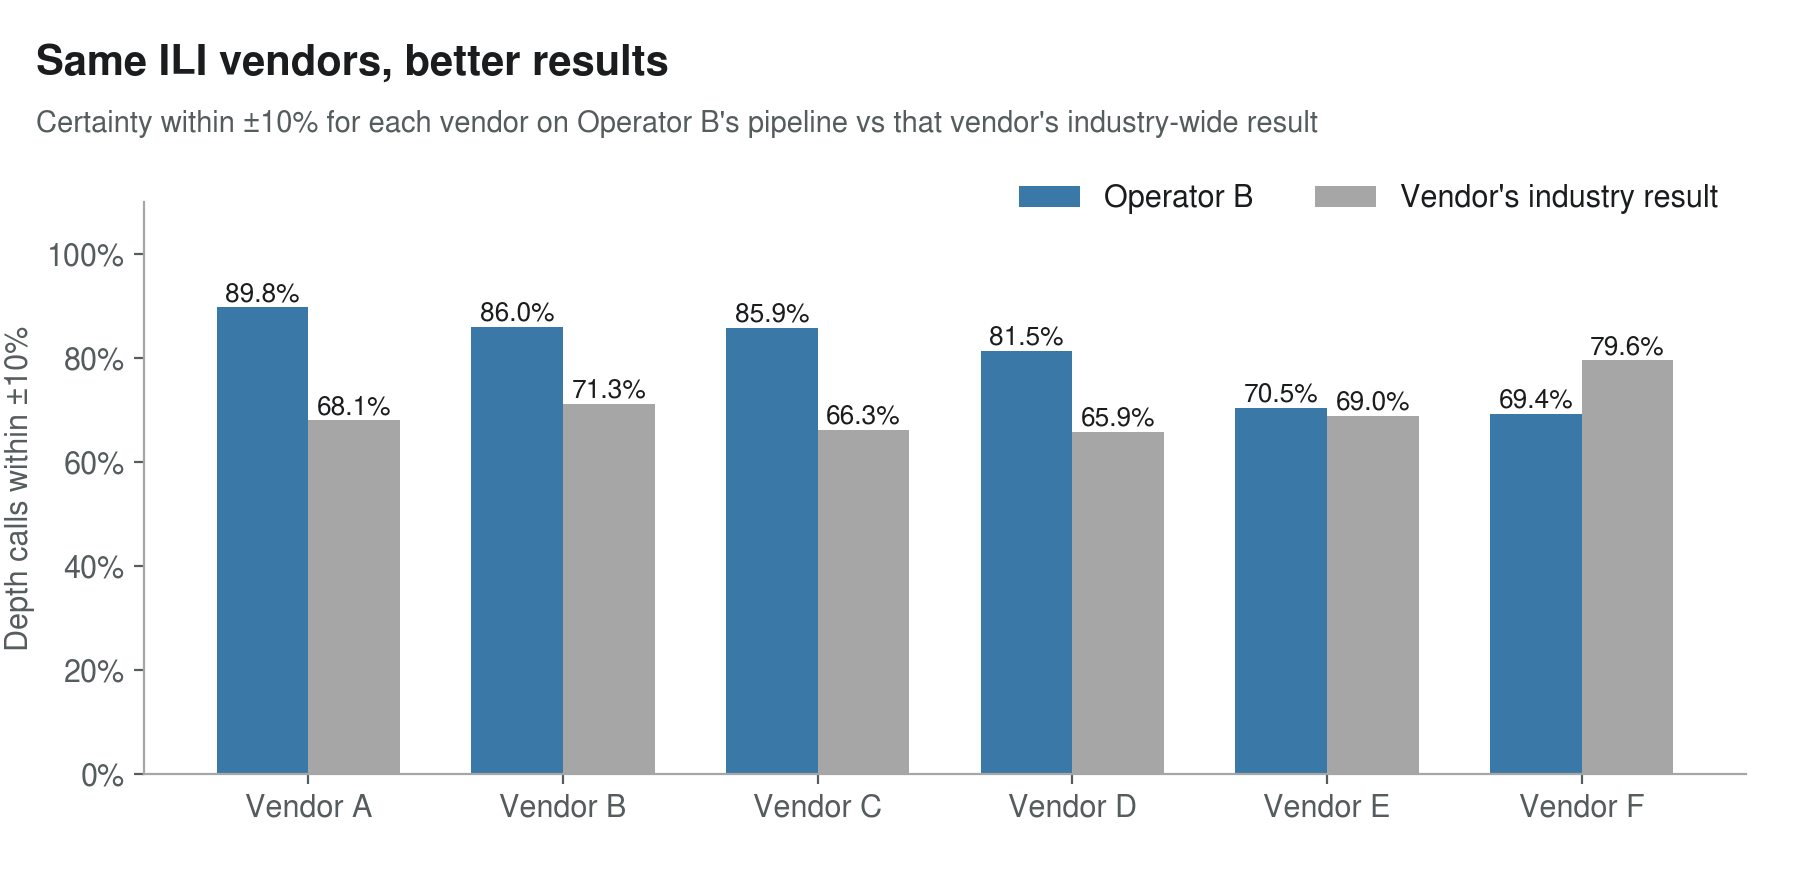
Source: Irth, 2026 State of ILI Performance. Industry benchmarks pooled across 20 operators in AIP. Operator B and vendors are anonymized.
Everything above pools one kind of data across many operators. There’s a second direction to grow, and it’s the one we’re building toward now: pooling different kinds of data on the same pipe.
Integrity data and damage prevention data have historically lived in separate systems, owned by separate departments, analyzed by separate teams. That makes sense for who owns the work, but it means the two datasets rarely meet, even though the threats overlap. Third-party damage remains a leading cause of pipeline failures, and a topside dent with metal loss is an immediate condition in high-consequence areas for both liquid and gas. So what does the density and location of 811 tickets in the vicinity tell you about the dents your ILI just found? Right now, for most operators, nothing, because nobody has ever put those two datasets side by side at scale.
Add licensed external feeds on top, i.e., weather and freeze-thaw cycles, soil corrosivity, satellite soil moisture, parcel and land grid data, and you can start asking questions no single dataset answers on its own. Is new external corrosion showing up where soil type and depth of cover say it should? Does circumferential cracking correlate with earth movement susceptibility? Are excavation patterns predicting mechanical damage before the next inspection finds it?
That’s the platform work we’re doing now, and it only pays off in proportion to how much data is in the pool.
Contributing takes less than most operators expect. We do the de-identification work, so you don’t need to scrub anything, build an export process, or stand up a governance project before you can participate. Your data is already in the platform, aligned and normalized. Handling it so that nothing traceable to your system ever surfaces in a pooled model or an industry benchmark is our job, and we treat it that way. Every model and benchmark in this post, i.e., the susceptibility models, the State of Integrity paper, and the 2026 State of ILI Performance report, exists because operators agreed to contribute their data.
The instinct to hold data close is different from the instinct to hold a methodology close, and it’s a more reasonable one. Data feels like exposure, i.e., a dig result that didn’t match the call, a run that missed the benchmark, a line that looks worse on paper than it is in the ground. That’s exactly why de-identification is our job and not yours. And pooling doesn’t only run one way. Every operator in the 2026 State of ILI Performance gets its own report back, benchmarked against peers it could never compare itself to alone. You get a view of your own program you can’t get any other way.
The future of pipeline integrity runs on shared learnings and shared data, and we don’t get one without the other.
Missed part one? It’s here. Want to talk about contributing data or a methodology? Reach out at sales@irthsolutions.com. Already an AIP customer? Ask your account rep for your operator’s 2026 State of ILI Performance report.
Learn how excavation ticket management uses analytics and risk scoring to identify higher-risk 811 tickets and focus damage prevention efforts.
Irth has acquired NetBenefit Software, adding local content and socioeconomic impact tracking to its stakeholder and land management offering.
Two-point corrosion growth rates are driven by ILI tool error. Learn how probabilistic CGR uses every ILI run, and how PRCI research could benchmark...